- Estimate thresholds or cutpoints of a variable of interest in the multivariable context of survival data or time-to-event data
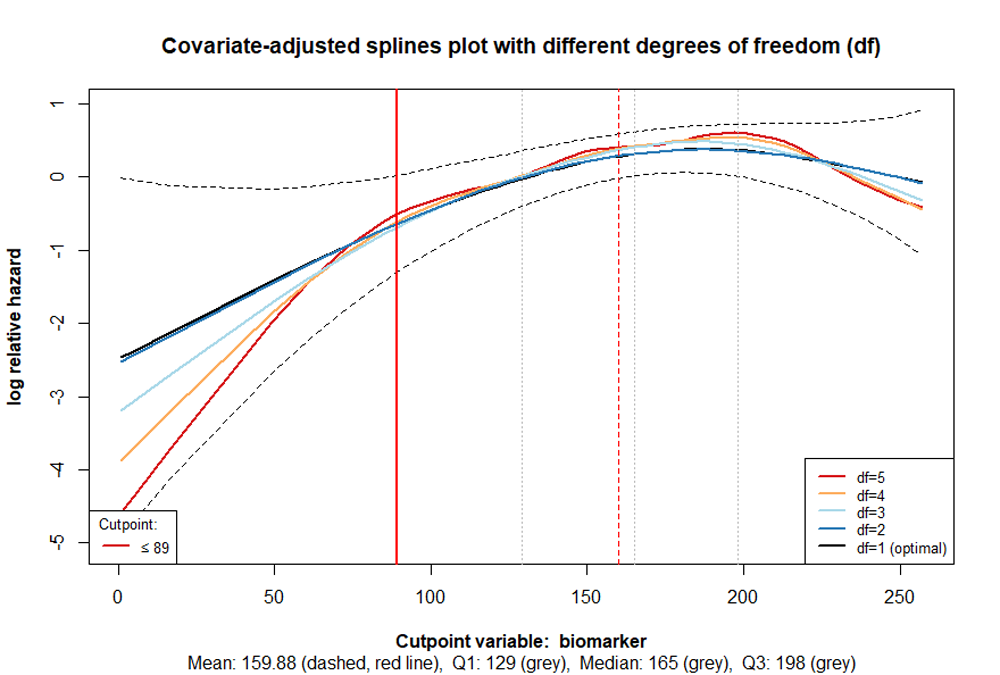
- Visualise the threshold or cutpoint estimation process using contour plots, index plots, and spline plots
- Estimate thresholds or cutpoints based on the assumption of a U-shaped or inverted U-shaped relationship between the predictor and the hazard ratio
Description
The R package cutpoint is used to determine thresholds or cutpoints of variables, such as biomarkers, in the multivariable context of survival or time-to-event analyses. These cutpoints are applied to form groups with different probabilities of an event occurring.
For example, in medical research, cutpoints of biomarkers are formed to classify patients into different risk groups regarding survival in tumor diseases. Using the R package cutpoint, it is possible to estimate one or two cutpoints for categorising a variable of interest, while taking other relevant variables into account. Thus, it is possible, for instance in the medical context, not only to estimate a cutpoint based on a single biomarker but also to consider other biomarkers or baseline characteristics.
The R packet cutpoint allows for a combined approach to determining cutpoints, particularly through numerical calculations and visual examination of different plots according to their functional forms.
For the numerical calculation, either the AIC (Akaike Information Criterion) or the LRT (Likelihood-Ratio Test statistic) is used to estimate the cutpoint in the context of Cox regression. The Likelihood Ratio Test statistic is calculated by taking the scaled difference between the log-likelihoods of the model and the null model’s log-likelihoods. Details on the methods can be found in the article by Govindarajulu, U., & Tarpey, T. (2022). Optimal partitioning for the proportional hazards model. Journal of Applied Statistics, 49(4), 968–987. doi:10.1080/02664763.2020.1846690